Following up on my previous post, I am releasing debvulns-exporter, a Prometheus exporter for tracking Debian system vulnerabilities. The underlying vulnerability analysis logic remains identical to the previously released MCP server and CLI utility.
Why an Exporter?
In my engineering workflows, I frequently deal with Debian and vulnerability management. Most enterprise environments rely on commercial, paid vulnerability platforms like Tenable or Rapid7. While these platforms provide extensive feature sets, I noticed a distinct lack of open-source tools tailored for this specific pipeline. While debsecan exists, it lacks a structured, parseable format suitable for building dashboards aimed at management consumption. What started as an experimental MCP server for learning purposes evolved into a practical question: why not convert it into a Prometheus exporter? Given that Prometheus is the de facto standard metrics platform across the industry, this architecture was the logical next step.
Design and Exported Metrics
The exporter is implemented as a native Prometheus exporter utilizing the prometheus-client library. It operates using two threads: one handles fetching the vulnerability data, parsing EPSS feeds, and cross-referencing installed packages to identify local vulnerabilities; the second handles serving the metrics endpoint. The full architecture details and metrics specifications can be found in the design doc. The specification was drafted during a technical brainstorming session with Claude 4.6 Sonnet on Antigravity prior to writing the implementation.
Testing and Dashboarding
To validate the exporter, I spun up older Debian 11 and Debian 12 cloud images sourced from the Debian Cloud team. The older image was intentionally selected to guarantee a standard baseline of unpatched vulnerabilities for testing. The local evaluation topology is structured as shown below:
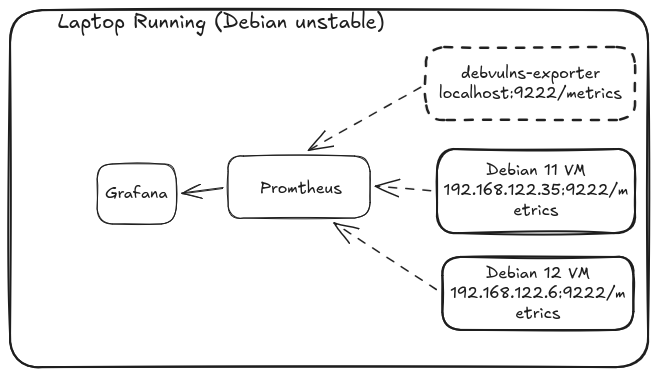
Rather than constructing the Grafana dashboard from scratch, I used Claude 4.6 Sonnet via Antigravity to generate the layout configuration. The generated dashboard for the local testbed functions effectively:
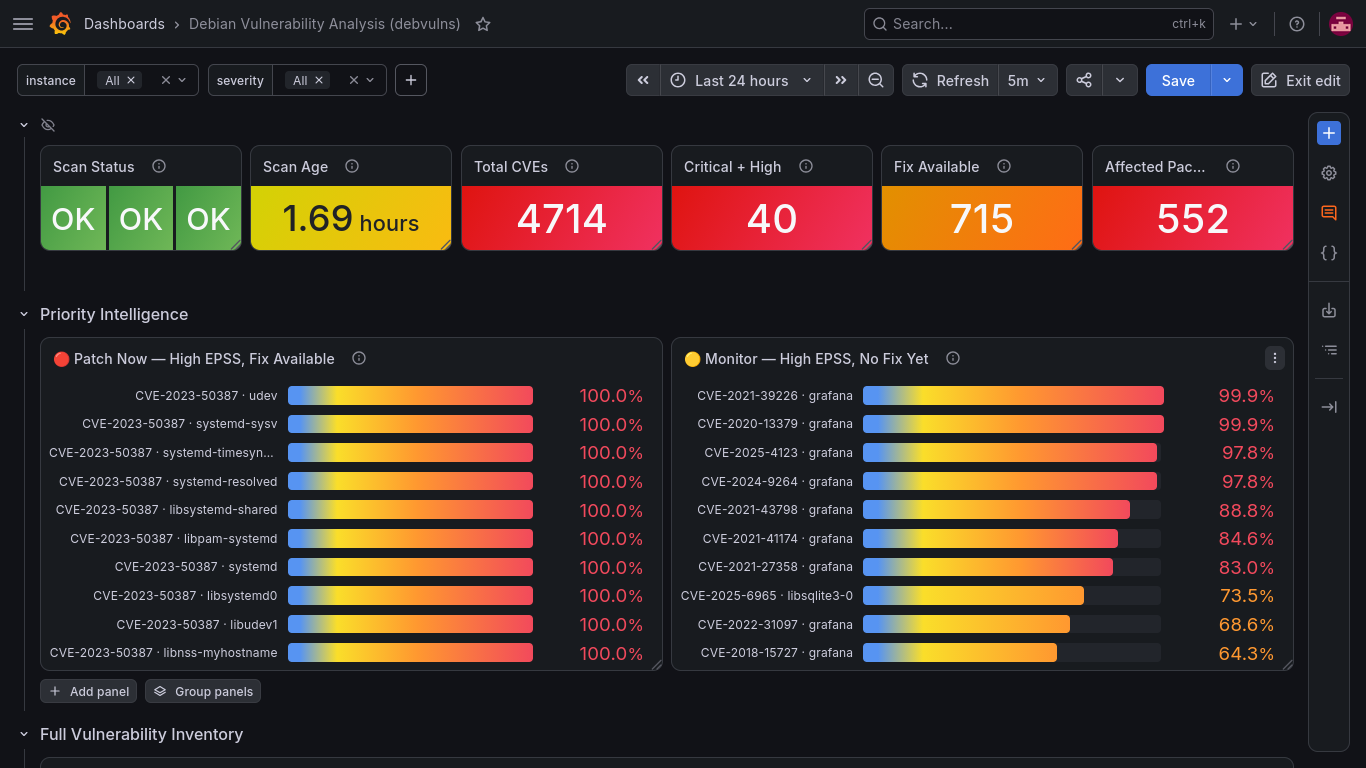
The complete, ready-to-import Grafana dashboard configuration is included directly in the debvulns source code.
Renaming the project
To prevent namespace conflicts and confusion with the native debsecan utility in Debian, I have unified the ecosystem under the debvulns moniker. The core CLI is named debvulns, the exporter is debvulns-exporter, and the MCP component is debvulns-mcp. The migration release has been published to PyPI, and the new consolidated repository is active at debvulns.
Conclusion
While this began as a personal utility to fill a niche tool gap, I expect it will be useful for others managing Debian infrastructure at scale. My next objective is to formalize Debian packaging for both the CLI and the exporter. The MCP component will likely remain available as an independent artifact. Until then, happy hacking.
Note: As a core design choice, `debvulns` still uses native `debsecan` as its ground-truth standard. The tool continuously cross-verifies its output against `debsecan` to ensure perfect functional parity and data consistency.